
A low expense ratio doesn't necessarily mean a cheap ETF to trade. When assessing expense ratios you should take into account the bid-ask spread, the amount of liquidity at a given price and how much it costs to trade relative to the annual savings from the expense ratio. The expense ratio only covers a portion of the cost to buy and sell a fund. The fundamental question is whether or not the savings cover the cost to hold the investment over a given period of time.[1][7]
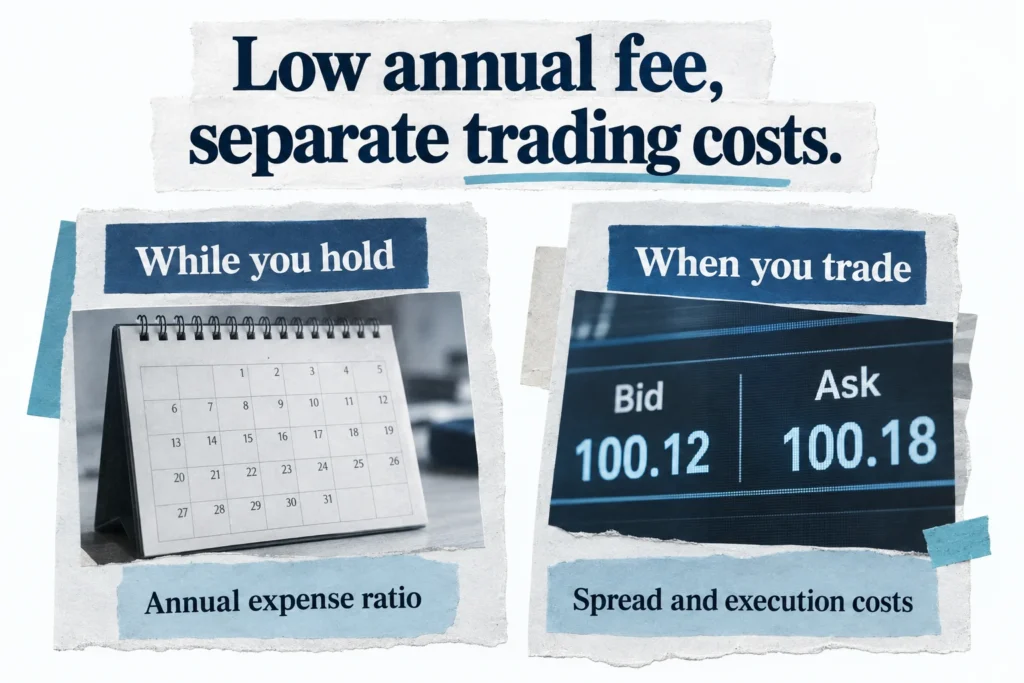
Imagine I’m entering a retirement-account reallocation, pleased with a three-basis-point fee reduction, when the order ticket shows a much wider spread than the alternative fund. I’ve already typed the share count. That’s annoying, but cheaper than noticing afterward. I leave the order unsent and calculate the dollars before deciding whether the lower annual fee earns its keep.
What the quote costs in dollars
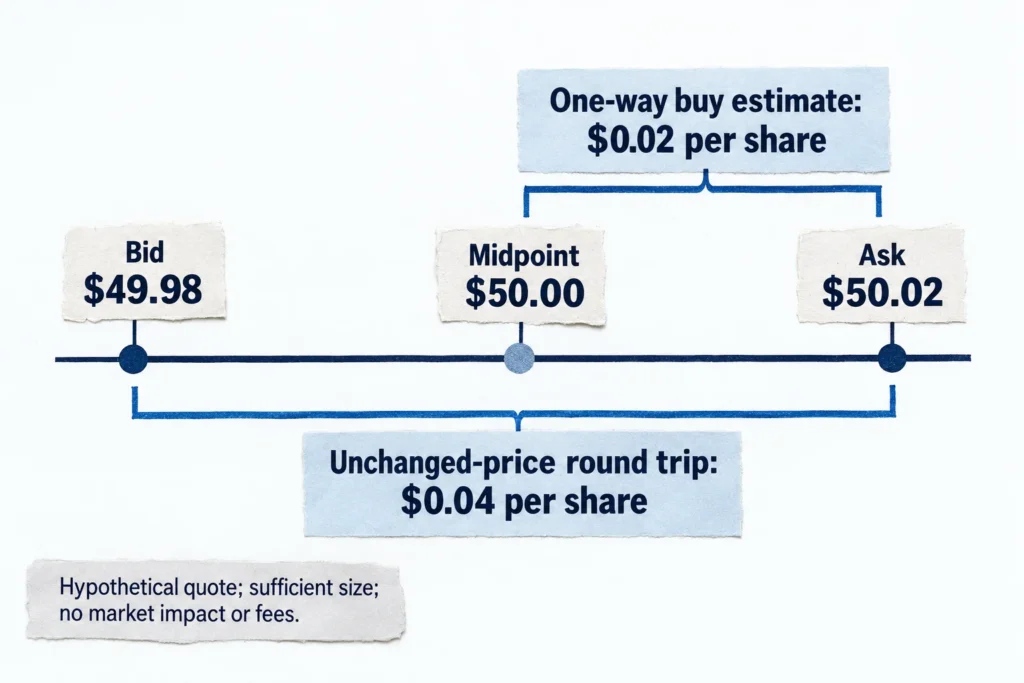
The bid is the highest quoted buying price; the ask is the lowest quoted selling price. Suppose a hypothetical ETF has a $49.98 bid and a $50.02 ask. Its midpoint is $50.00, and its spread is $0.04 ÷ $50.00 = 0.08%, or eight basis points. Comparing cents alone can mislead you: the same four-cent spread is a larger percentage of a $20 share than a $100 share.[1][2]
The distance from the midpoint is two cents per share, or the half-spread. Buying at the ask and selling at the unchanged bid is a loss of four cents per share, or the full spread. This example assumes quote stability, sufficient available size, no market impact, and no costs.[1]
| Shares | Value at $50 midpoint | Cash to buy at $50.02 | One-way buy friction | Unchanged-price round-trip friction |
|---|---|---|---|---|
| 10 | $500 | $500.20 | $0.20 | $0.40 |
| 200 | $10,000 | $10,004 | $4 | $8 |
| 2,000 | $100,000 | $100,040 | $40 | $80 |
I use the midpoint as a reference to the math. Actual trades can receive price improvement. Quote slippage and market impact can occur. If the quote shows 100 shares available, the quote does not establish what the rest of the 2000 shares would cost. It’s possible the liquidity is available, but proving this by quote multiplication does not prove it.[4][5]
How long does the lower fee need to catch up?
Imagine two ETFs equivalent in exposure. Fund A is 0.06% and has a 0.20% spread. Fund B is 0.09% with a 0.02% spread. On $100,000 of midpoint value, A’s annual fee advantage is $100,000 × 0.03% = $30. To purchase Fund A at the ask would cost an estimated $100 above the midpoint. To purchase Fund B at the ask would cost an estimated $10 above the midpoint. The extra $90 takes three years to break-even, considering the fee savings, before an exit is considered.
Assuming an eventual sale at the same spreads, the incremental round trip friction is $200, or $20 = $180. At $30 a year saved, that’s six years to break even. I find this a more constructive comparison than naming either fund “cheap,” since the answer to that question depends on the holding period. The example provided assumes no changes in balance, gross returns, quoted size, spreads, or other costs; assumes fills at the bid and ask; and illustrates no forecast of future fills.
When making recurring purchases, apply spreads to what you actually purchase, not to your overall portfolio. Twelve purchases of ten shares at the earlier hypothetical quote add $6,000 of midpoint exposure and cost $6,002.40 at the ask, or $2.40 of estimated entry friction. Switching an existing holding is different, as you sell what you own, and you must consider both the sale and the purchase and any charges or taxes.
The issuer page and order ticket answer different questions
The issuer’s 30-day median bid-ask spread gives you a baseline for what trading has usually looked like. For ETFs covered by SEC Rule 6c-11, it uses national best bid and offer observations every ten seconds during trading days in the preceding 30 calendar days. Each spread is divided by its midpoint, and the median is rounded to the nearest hundredth of a percentage point. That rounding matters: 0.01% isn’t an exact promise of one basis point, and 0.00% doesn’t mean free trading.[2]
I’d use that history to spot an unusual quote, then use your brokerage’s current bid, ask, timestamp, and displayed share sizes to estimate the order in front of you. A delayed quote or last-traded price can’t do that job. The issuer’s premium-and-discount history is also worth opening, but it answers a different question: how market prices have compared with reported NAV, not what your next trade will cost.[1][2][5]
Low volume isn’t a verdict, and a discount isn’t automatically a bargain
Liquidity for ETFs is also screen-dependent. If the ETF holds easy to trade assets, it may be more liquid than volume indicates. Active ETFs, however, can still become very illiquid and expensive. Creation/redemption are not an unlimited-liquidity machine.[5][6]
Premium-and-discount history explains how the ETF’s market price compares to reported NAV. Look for large, persistent gaps and unwanted surprises during market gaps. Check the dates, and the issuer’s market price convention before comparing historical NAV to current market price. NAV gaps and market price spreads can be large even when the market is quiet, but that doesn’t mean they aren’t tight.[1][2]
Foreign ETFs may have traded hours, or even days, ago, while foreign bonds may only trade or be quoted infrequently. Fair value adjustments can eliminate timing differences, and an underlying closed market does not necessarily mean staleness in NAV. The BIS study indicated that during March and April 2020, ETF prices may have reflected information faster than stale NAVs. This does not mean you should disregard all discounts and try to capture them. I would not treat this as a free lunch. Likewise, you should not mechanically add a reported discount to the spread to capture both costs.[3][6]
Choose an execution approach worth the trouble
For a modest routine purchase with a normal, narrow spread, I wouldn’t turn a few cents of modeled friction into a monitoring project. Automated or fractional purchases may give you less control: check whether your broker lets you set a limit price or choose execution timing, rather than assuming the recurring-purchase feature works like a manual order.[4][5]
For a manual trade, a buy limit caps the price you’ll pay and a sell limit sets the minimum you’ll accept. That’s useful control, but it doesn’t guarantee execution or a complete fill. A buy limit at the current ask still crosses the spread; a midpoint limit may sit unfilled, and even a midpoint fill wouldn’t prove you bought at fair value. You’re choosing an acceptable price, not erasing all trading costs.[4]
A wider than normal bid-ask spread is a reason to take a pause if you have some flexibility with your order. The spreads are not always at their widest at midday in the U.S. You will want to recheck with the markets are open and active. Consider what might be driving the spread in your favor. If the displayed liquidity is not large enough to fill your order, you should ask your broker if the trading desk can give you a full-size executable quote, or price improvement, and what that would cost you. Finally, if your order size is large, it doesn't always mean that you will pay the price of the bid or ask. You should multiply the bid by the number of shares you want to buy or the ask by the number of shares you want to sell, to help come up with a more accurate estimate of your potential price.[5]
Determine how costly this friction is and compare to a similar ETF with a lower spread. Account for all costs the mutual fund charges. No spread does not mean no costs. Consider switching to a no spread fund/ETF only if the exposure and cost alignment justify it.[7]
Sources and references
- SEC Office of Investor Education and Advocacy: Updated Investor Bulletin: Exchange-Traded Funds (ETFs)
- Electronic Code of Federal Regulations / SEC: 17 CFR 270.6c-11, Exchange-traded funds
- BlackRock / iShares: iShares Core MSCI Emerging Markets ETF summary prospectus
- FINRA: Understanding Order Types Can Save Time and Money
- State Street: Optimizing Trade Execution for ETFs of All Levels of Liquidity
- Bank for International Settlements: The anatomy of bond ETF arbitrage
- SEC Office of Investor Education and Advocacy: Mutual Fund and ETF Fees and Expenses, Investor Bulletin